Freezing problem

Hello,

My build of Handmade Hero has a strange problem where, after running for some (relatively short) amount of time, the entire window will lock up and stop taking input until I Shift-F5 in VS to stop debugging.

It started happening some time around when we started using the Empty Space entities. It would initially happen pretty much any time I went upstairs and then into the next "empty space", but it stopped happening again when we disabled stairs for groundbuffers. Recently it's been happening again more frequently even without stairs, and now that I've got a rotating large tree on my screen it happens after a few seconds (even without the Hero being spawned). It doesn't happen so frequently if I reduce the scale of the tree.

I'm struggling to see the connection between any of this. The RAM usage of the process doesn't go up (it stays at a consistent 13mb). Sometimes it happens very quickly after startup, sometimes it takes a long time. Sometimes moving around the world will make it happen sooner but sometimes it'll happen just staring at the first room without even spawning the Hero.

The fact that the entire window goes unresponsive makes me wonder if it's getting stuck in an endless loop somewhere.

Has anyone run into this or something similar, or has any tips on where I could start debugging it?
Have you tried pausing the program in the debugger during the freeze (the pause button in the toolbar)? That should take you to the line that's currently executing, which will help you (and / or us) to figure out where and why the game hangs.
Clicking the pause button results in VS opening a "No Symbols Loaded" tab calling out "ntdll.pdb". This also happens if I attempt to run the .exe outside of VS and attach to the process after it hangs.

That did, however, allow me to attempt something I couldn't do before - generate a dump file. (The option in VS was previously greyed out, and trying to create one through the Task Manager just sat there doing nothing for ages).

Unfortunately, the creation of the dump file fails with an error "Error saving dump. Invalid pointer"

EDIT: I'm downloading the symbols for ntdll.pdb now from Microsoft Symbol Server

Edited by Matthew on
Does your callstack window show anything besides the call into ntdll?
Nothing that seems helpful to me, but perhaps you can make more sense of it:

http://puu.sh/h4JHc/c0d1e305fc.png

Also, downloading the ntdll.pdb symbols just turned the error into "Source Not Available - Source information is missing from the debug information for this module".

EDIT: Actually, that would seem to suggest DirectSound is the culprit... but I haven't touched anything to do with sound since we removed the Sine wave, months ago. That's weird.
Edited by Matthew on
The dsound.dll in the callstack leads me to believe this is an issue with DirectSound. I'm quite a bit behind on following Casey's progress, so I'm not sure if he's changed anything in this part recently. In any case, try disabling sound by commenting out the lines that write to DirectSound's buffer and see if it helps. It's not a fix, but if the freeze stops happening, we'll know for sure where to look.

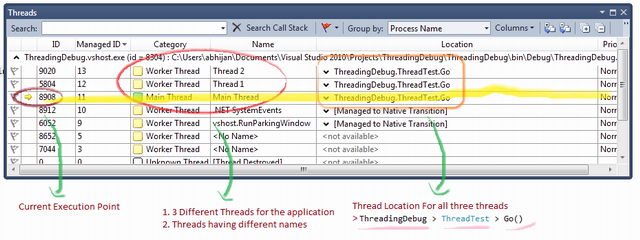
My money is on an infinite loop after locking DirectSound's buffer (or maybe, but less likely, a deadlock). See if you can get VS to show callstacks for all threads in your process. I don't have a Windows PC handy right now and don't know VS well enough to tell you the menus where you can find this, but if my memory serves me right, you should be able to bring up a list of threads in the debugger, then double click on one to see its current callstack. Look for the main thread, which should have calls into the HH platform layer.
Thankyou so much! That thread thing in Visual Studio is a lifesaver.

So, what was happening was actually in the framerate fixing code. Sometimes, if the SecondsElapsedForFrame was just right, I'd end up subtracting 1 from a DWORD which was already 0, which would cause the main thread to sleep for INTMAX milliseconds. Just dumb bracketing. I guess it didn't raise its ugly head until the code was actually doing some more graphically intensive work.

Thank you thank you! Now I can get back to coding happily!
Ah, that makes sense. By the way, does anyone here know how VS selects the current thread when pausing the program? Last active? Last created? Most misleading for the current bug hunt?
I don't know how it chooses that, but you can always see what other threads are doing by double clicking on thread in "Threads" window:


When you do that, then call stack and variables/watch window will show info for the thread you clicked.

Edited by Mārtiņš Možeiko on