Greetings, I'm on day 003 (just starting). I'm debugging win32_handmade.exe using Visual Studio's debugger. I set a break point at the line of code for the WM_Close case and then start stepping through it. Once I step through the break command the Debug window prints the words " Source information is missing from the debug information for this module" and that's all I see in the Window. The program keeps running but I am unable to see what line of code the debugger is on. I'm not sure how to stop this from happening.
Edited by UnsightedMonk
on
The Win32MainWindowCallback function is, as its name imply, a callback function, meaning that it's a function that is called when something happens in the program. In this case a message was posted on the window message loop. And it's called indirectly by you from the call to DispatchMessage. But Windows can also call it directly in some cases.
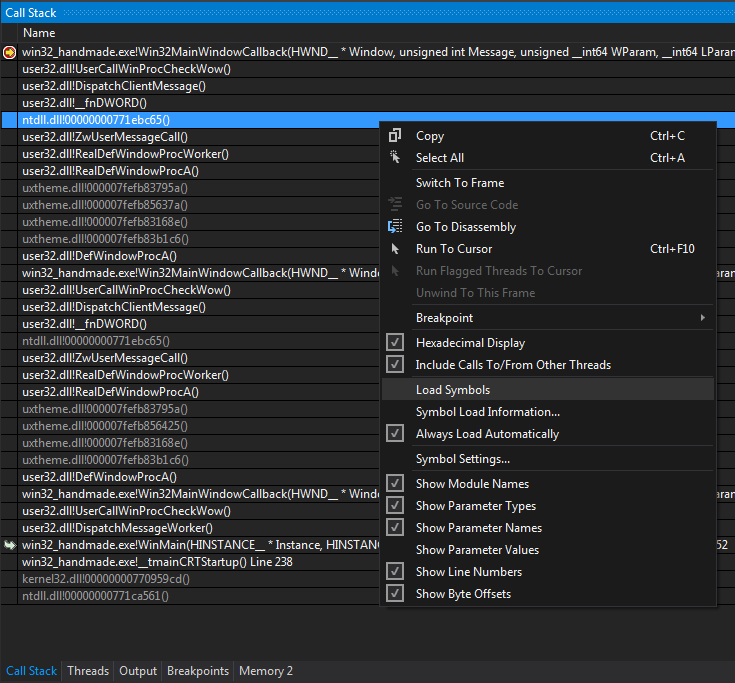
If you look at the callstack (the list of functions called to arrive at the line where you put the breakpoint. While on a breakpoint: Debug menu > Window > Callstack) you'll see that a bunch of functions where called. Near the bottom you'll see your WinMain function and at the top the callback. In between are functions that are part of Windows and you don't have the source code for those. So you can't step in the code (but you can step in the disassembly). You can get the name of those function by right clicking on them in the callstack and choose "Load Symbols".

When you try to step after the WM_CLOSE message and go out of the MainWindowCallback function, you see the instruction of all those "Windows functions". To avoid that you can double click on the WinMain function in the callstack (win32_handmade.exe!WinMain) to view what function call is at the root (here it's DispatchMessage), place a break point there and continue the execution (F5).
If you look at the callstack (the list of functions called to arrive at the line where you put the breakpoint. While on a breakpoint: Debug menu > Window > Callstack) you'll see that a bunch of functions where called. Near the bottom you'll see your WinMain function and at the top the callback. In between are functions that are part of Windows and you don't have the source code for those. So you can't step in the code (but you can step in the disassembly). You can get the name of those function by right clicking on them in the callstack and choose "Load Symbols".

When you try to step after the WM_CLOSE message and go out of the MainWindowCallback function, you see the instruction of all those "Windows functions". To avoid that you can double click on the WinMain function in the callstack (win32_handmade.exe!WinMain) to view what function call is at the root (here it's DispatchMessage), place a break point there and continue the execution (F5).