Visual Studio debugging takes 15 seconds to start

Hi, I'm following handmade hero and everything works fine. Except for 2 visual studio issues that I think are linked.

When I start to debug in visual studio I've got this window that opens :
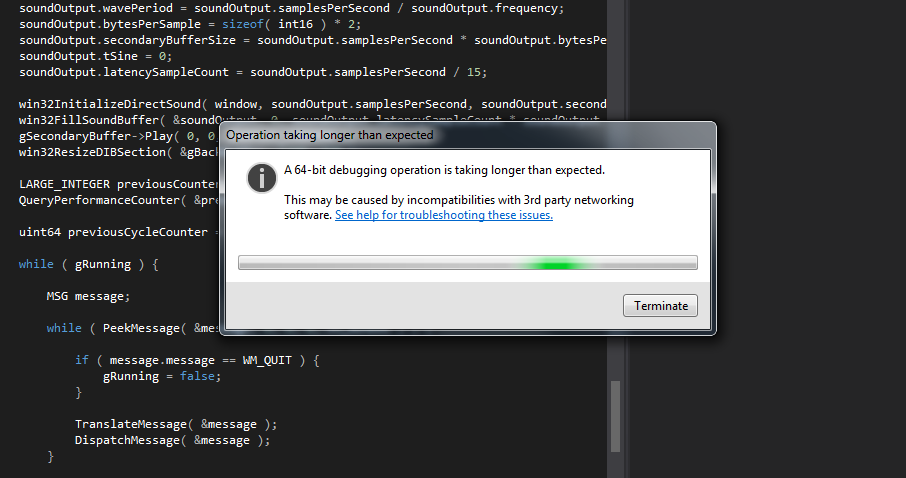


And it take about 15 seconds to start debugging. The link points to that MSDN page. I've never touched to remote debugging.

The second problem is that when I start debugging or I start handmade.exe manually (command prompt or double click) the application runs twice. One window opens and stays on the screen for a few seconds than close and another window opens and stays opened. If it's launched for debugging, the first windows will not trigger any breakpoint (visual studio debugger is not started, no orange bar on the bottom) so I'm thinking that it's what is causing the debugger to take so long to start.

Note that the "dual launch" also happens on other projects in visual studio, 32bit or 64bit, release or debug builds.

Any idea of what could be the problem ?

I'm using Visual Studio 2012 pro on Windows 7 64bit.
The .exe and .cpp.

Thanks !

Edited by Simon Anciaux on Reason: Attachement not working
Your code compiles and runs just fine on my machine. No problems with the debugger startup time, no "dual launch".
I`m not sure what can cause your problem though. There must be some problem with your dev environment, I believe.
From the page you linked:

If you debug a 64-bit application on the local computer, Visual Studio uses remote debugging to connect between WOW64 and the 64-bit application on the same computer.
It seems that Visual Studio has to use the "Remote Debugger" even when debugging applications locally, as long as you are targeting x64 with your application.

Apparently, this means that the debugger can run into issues with your network settings. Hard to tell exactly.

As always, take StackOverflow answers with a grain of salt, but here's what I found:

http://stackoverflow.com/a/16885066

Seems to possibly conflict with ZoneAlarm software:

http://stackoverflow.com/question...al-64-bit-debugging-msvsmon-issue
Thanks for the replies.

I tried the commands from the first the stackOverflow link:

1
2
netsh winsock reset catalog
netsh int ip reset reset.log hit

It fixes both problems (debugger start directly and I don't have the "dual launch"). But it remove my IP address settings (which is expected from those commands) and if I set them back the problems start again. I'll keep searching in that direction.
This was a known issue in VS2012. I would first make sure you have the latest update to VS2012 installed (Update 4), as they released a couple "fixes" for the debugger networking over the product's lifetime.

Basically, the issue was that certain third-party software would interfere with or block VS's IPv6 networking connection to the debugger process. It's supposed to fall back to IPv4 when IPv6 doesn't work (which might be the delay you are experiencing?)

If updating to the latest update doesn't fix the issue you might try turning off / stopping any third-party software you have that might be interfering with your local machine's network. Things like anti-virus, VPN, firewall, etc. all could be causing this issue.
The antivirus ( Avast ) was in silent mode and apparently didn't liked win32_handmade.exe (it was doing a "deepscan" on it when I switch off silent mode, and the scan seems frozen). I updated the antivirus and everything seems to work now.

Thanks for the help.